Pr
Similar topics
ices and Charts

NZD Gold Pulling Back Towards Uptrend Line
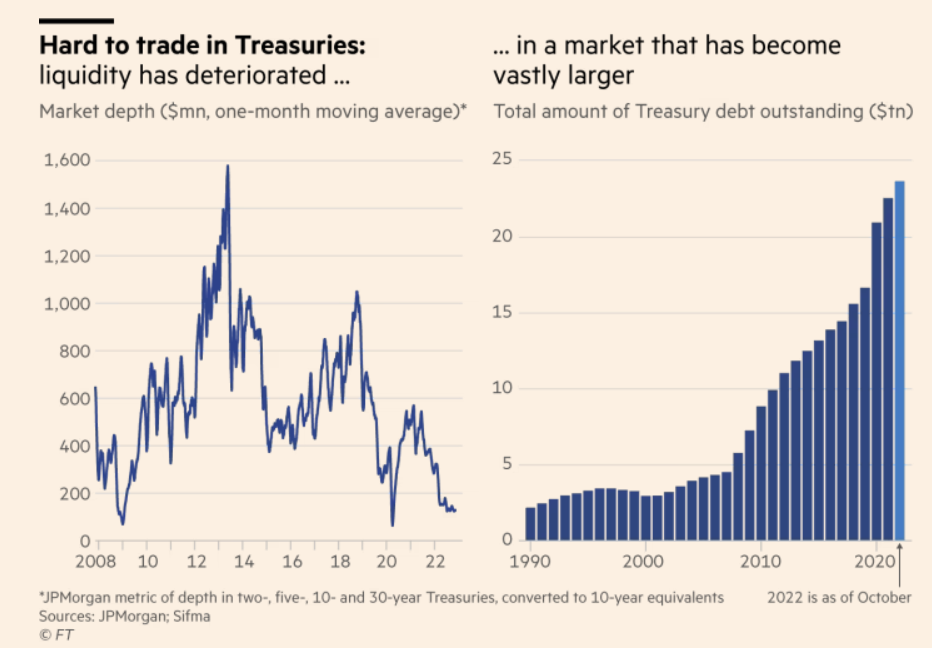
Gold in New Zealand dollars is down $73 (2.5%) from a week ago. Pulling back as expected towards the blue uptrend line. Maybe we’ll see a bounce from around $2800 or just below? Then we’re watching for a move back up towards $3050 again.
While in USD terms, gold was down just over 2% from 7 days prior. After clearly breaking through the downtrend line, and getting overbought, USD gold has pulled back as we thought it would. It could dip a bit lower yet too and test the breakout below $1700.
NZD Silver Sits Where the 50 and 200 Day MA Converge
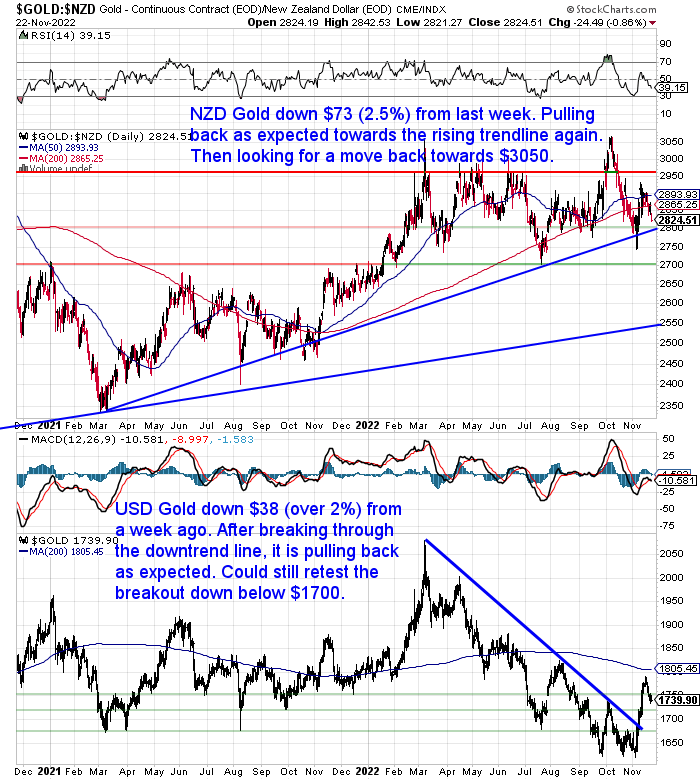
Silver in NZD dropped a similar amount to gold percentage wise. Or down 97 cents. NZD silver now sits right on the point where the 50 and 200 day moving averages (MA) converge at $34. So this could be a likely place for them to find support and bounce back up.
In USD, silver was down just over 2% from last week. Can it bounce from around here? Or maybe it will need to dip a bit lower nearer to $20?
RBNZ 0.75% OCR Increase Nudges NZD Higher
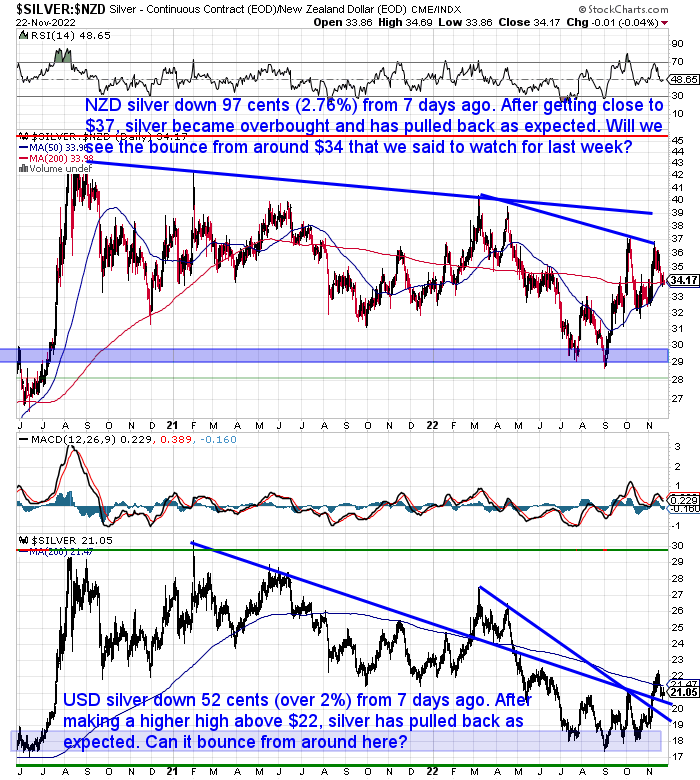
The New Zealand dollar is up 23 basis points from a week ago. All of that rise came after the NZ Central Bank announced a hefty 0.75% interest rate increase at 2pm today. While this was a record rate hike it was largely expected by the market and so the Kiwi hasn’t moved too much as a result.
The RBNZ like other central banks are putting on their inflation fighting fire hats. But as we discuss further on today, we wonder whether they’ll be prepared to keep them on for as long as they’d like us to believe?
Plus in our view these interest rate increases aren’t likely to have the effect on inflation that the RBNZ would like. It is not a “combination of supply chain problems, geopolitical tensions, pent-up demand from lockdowns and a lack of labour” which have caused the current inflation as the likes of this article says.
Inflation situation: Could we ever see a return of the 1980s’ 20% rates?
(Who would have thought we’d see a mainstream NZ article contemplating 1980’s interest rates?)
But rather the damage has already been done in the past with the massive increase in currency supply here and around the world. The chickens are coming home to roost and they won’t be turned back so easily.
Need Help Understanding the Charts?
Check out this post if any of the terms we use when discussing the gold, silver and NZ Dollar charts are unknown to you:
Continues below
Long Life Emergency Food – Back in Stock
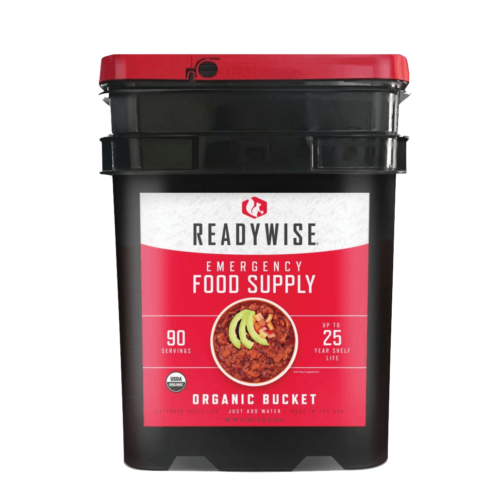
These easy to carry and store buckets mean you won’t have to worry about the shelves being bare…
Free Shipping NZ Wide*
Get Peace of Mind For Your Family NOW….
—–
What Type of Silver Bar Should I Buy in 2022? – The Ultimate Guide to Silver Bars
This week we finally have NZ refined 5oz and 10oz silver bars back available for order.
The estimated dispatch time is also down to 2 weeks for these, while orders for 1kg silver bars now won’t be available until the new year. So if you’re mulling over what type of silver bar to buy, then be sure to check out this week’s feature article. You’ll learn everything you need to know when buying silver bars including:
- When to choose silver bars over silver coins
- What size silver bar to buy
- Pros and cons of different silver bar sizes
- What’s the most commonly purchased silver bar size
- Different brands of silver bars
- Cast bars vs minted bars


Your Questions Wanted
Remember, if you’ve got a specific question, be sure to send it in to be in the running for a 1oz silver coin.
Cracks in US Treasury Bond? Will This Prompt More Buying of Precious Metals?
Following on from last week’s comments on UK gilts (government bonds), we’ve been digesting a bit more information on the state of global bond markets.
Our “secret investment advisor”, Chris Weber (learn more about him here) this week shared a thought provoking article from the Financial Times on the cracks starting to appear in the US Treasury bond market.
The cracks in the US Treasury bond market
The meltdown in UK gilts exposed the vulnerability of large bond markets. Could the biggest of them survive a wave of selling?
The problem currently is that the Fed is trying to sell down its more than $7 trillion worth of treasury bonds. But with interest rates continuing to rise this means bond prices continue to fall. So finding buyers is not proving to be so easy.
The FT article explains how commercial buyers and sellers of US government bonds are finding the liquidity in the bond market is poor compared to recent history. So it is taking much longer to fill trades than it used to.
Chris Weber then points out:
“What struck me is that the Fed can put an end to this [low liquidity] by ending its bond sell-off, or even starting to buy bonds again in massive monetary easing. The Fed is in a very difficult situation. Even if it wants to reduce inflation, caused by its open market operations in selling bonds, it may not be able to continue to do so. In other words, “Forced To Inflate”.
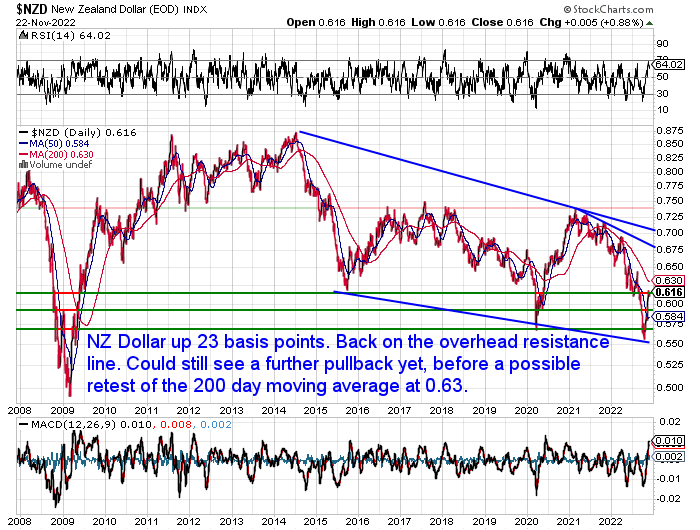
The two charts below illustrate this dire situation.”
“The one on the left shows how the trading volume in Treasuries has shrunk. It is now nearly as bad as 2008, when the banking system was in danger of freezing, and early 2020, when the Covid panic hit the markets and froze trading. But neither of these events are present today. Instead, everyone who borrows or lends is shocked at the unprecedented increase in Treasury yields over the last 12 months.
…The second chart shows the huge increase in Treasury debt since 2008. This is the result of the Fed printing money: creating it out of thin air. Now they are caught. Their prior actions have caused inflation, and since they stopped pushing down interest rates those rates have zoomed. This pushes down bond prices, and hence, fewer people want to own them.
The ones who own the most of them, the Fed and the Bank of Japan, have been systematically selling them over the past year or two. But the numbers of smaller holders are also getting rid of them.All these sellers and almost no buyers. All the while, the supply has grown enormously, courtesy of the Fed.
It would be deeply ironic if the same Fed ended up buying more Treasury debt, the very action which starts the inflation process. And yet it looks like this is the way things will go.
The creator of the debt will likely be the only one who stands ready to buy them. But that action will boost the balance sheet, and start the inflation process all over again.These next few years are not going to be easy; you can look at what is coming as the price that has to be paid for the artificial ‘good times’ of the past years. This is also known as ‘kicking the can down the road’. The problem is that the road is ending in a cul-de-sac, otherwise known as a dead end.
…The Fed has impressed people who didn’t believe it could stay so tight and have rates so high. At some point you have to believe it will panic, if the economy falls apart, or if the Treasury bond market does. This to me, remains the safest bet. If so, then which investment class should most benefit? Maybe I’m falling too easily for it again, but I’m thinking it will be the precious metals, especially silver.
…The thought occurs that the market will soon start discounting new Fed easing as a way out of the Treasury mess. It may already be in the process of doing so.
If this is the case, then it is a good argument for a new bull market in the precious metals.”
FTX Saga: The First of Many Collapses to Come?
If you want to read a great summary of the recent FTX digital currency exchange collapse, this one from Myrmikan Capital is hard to beat…
The conclusions are hard to argue with and point to this being just one of many collapses to come. And not just in the virtual currency world…
“In addition to general lessons, the FTX saga has more immediate implications for investors. First, it is yet another signal that the COVID bubble is collapsing and at an accelerating pace. The COVID bubble rests atop the QE bubble, which sits on the shadow banking system bubble, which relies on the banking bubble, which depends on the currency bubble. The questions are at what layer of bubble will the Fed make a determined defense and will it be successful.
The second revelation of FTX is just how long it takes for wildly insolvent institutions to fail. Panics always start at the periphery. In the nineteenth century they would start in places like Argentina and take a whole year to reach back to London. Sub-prime housing exhibited the same phenomenon, taking eighteen months to travel from trailer parks to Wall Street.
Each institution scrambles to survive: Bear Stearns, then Fannie Mae, then Lehman, then AIG, then Citigroup; Luna, Three Arrows, Voyager, FTX, Blockfi. It sells equity, borrows money, supports asset prices in the market, perhaps misappropriates funds, and then fails. And that only starts the process for the next company in the chain. It is, perhaps, remarkable that the entire crypt0 universe did not collapse Monday morning.
But, as the above shows, it takes time for contagion to spread.The panic will at some point jump to more traditional financial institutions, and not just those involved in crypt0. We can use the same analysis as above to understand why no major institution has yet failed from the vertical spike in interest rates.
Much recent investment chatter points out that nearly all mortgages in the U.S.
are fixed-rate, as opposed to those in the U.K., Canada, and Australia. But someone is on the hook for the money. No one ties up money for thirty years to lend at a fixed 2.7% interest rate. The shadow banking system allows short-term capital to fund long-term investments in the same way that demand deposits at banks are used to finance mortgages and industrial loans. Given that mortgage rates were mostly below 4% since 2012 and nearly the entire U.S. Treasury bond yield curve is mostly above 4% (and lenders have to pay a premium above that yield to access capital), someone is taking persistent losses:
especially for recent mortgages, they are getting 3% yield on their capital while paying 5% or 6% to access capital.We will hazard a guess that it is the pension funds and insurance companies, those who were buying the equity tranches of CMOs, that will suffer the greatest losses. Their balance sheets are huge, and they will be able to stagger on for a time. Others will provide additional capital knowing that they are systemically critical. In the end the Fed will not allow them to fail. It will have to print. This time when capital panics out of the dollar and dollar assets, there is one fewer exit.”
Source.
So both these pieces point to the most likely result of all this is for the Fed (and other central banks), to simply try and print their way out of the messes that are yet to come. That is to solve the problem with exactly what caused it in the first place. It’s hard to see how this won’t in end in further significant devaluation of all fiat currencies.
Have you got sufficient protection?
- Email: [email protected]
- Phone: 0800 888 GOLD ( 0800 888 465 ) (or +64 9 2813898)
- or Shop Online with indicative pricing
— Prepared for the unexpected? —
Never worry about safe drinking water for you or your family again…

The Berkey Gravity Water Filter has been tried and tested in the harshest conditions. Time and again proven to be effective in providing safe drinking water all over the globe.
This filter will provide you and your family with over 22,700 litres of safe drinking water. It’s simple, lightweight, easy to use, and very cost effective.
Shop the Range…
—–
Source link

