Pr
This may also be of interest to you
ices and Charts

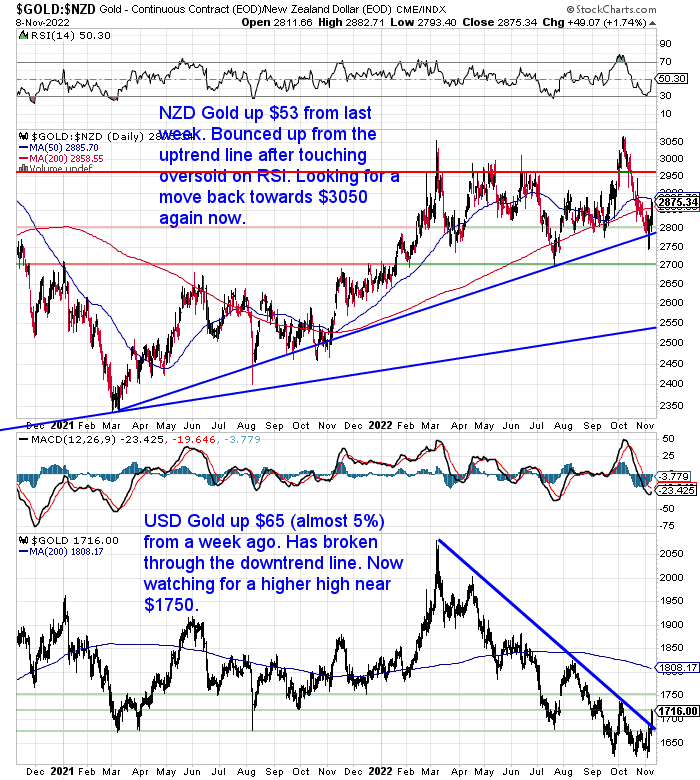
NZD Gold Up Almost 2%
Gold in New Zealand dollars dipped down to the blue uptrend line during the past week. But then after touching oversold on the RSI, gold has bounced up from there to be up $53 or close to 2% from 7 days ago. We’re now watching for a move back towards $3050 again. But NZD gold remains in the clear uptrend it has been in since early 2021.
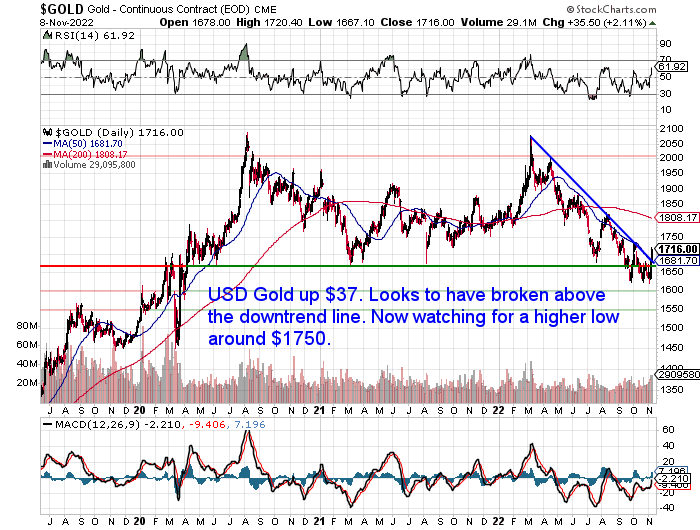
USD gold is up by almost 5% from a week ago. It has broken above the downtrend line. But we now need to see it make a higher high above $1750 to confirm this is not just a fakeout.
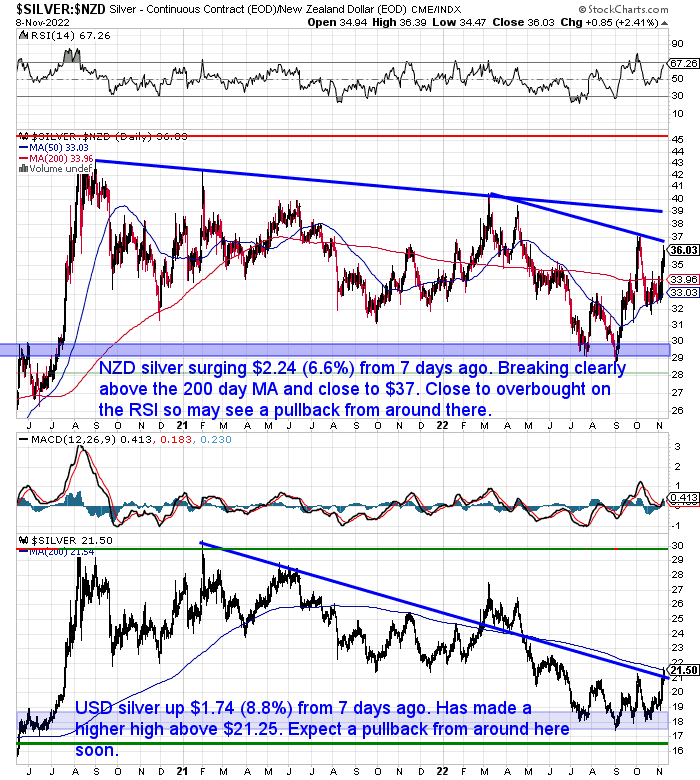
NZD Silver Surges over 6.5%
Silver in New Zealand dollars has surged even stronger than gold. It is up by $2.24 from a week ago or a hefty 6.6%. NZD silver is clearly back above the 200 day moving average (MA) and now just below the high from early October. However it is close to overbought on the RSI so we could expect a pullback from around the $37 mark. Silver continues its 2 year sideways pattern. We need to see it get back above $39 to break out.
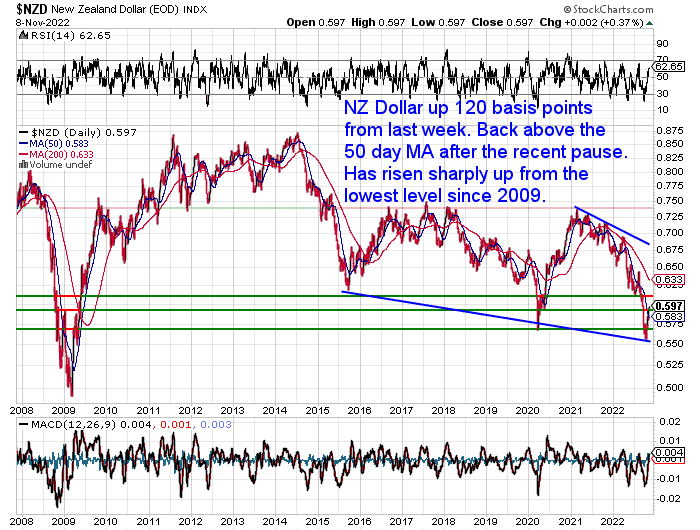
New Zealand Dollar Up 2%
The Kiwi dollar is up 120 basis points or 2% from 7 days ago. It is back above the 50 day MA after its recent pause. Having risen sharply from its lowest level since 2009. But could run a little higher yet too.
Need Help Understanding the Charts?
Check out this post if any of the terms we use when discussing the gold, silver and NZ Dollar charts are unknown to you:
Continues below
Long Life Emergency Food – Back in Stock

These easy to carry and store buckets mean you won’t have to worry about the shelves being bare…
Free Shipping NZ Wide*
Get Peace of Mind For Your Family NOW….
—–
1970’s and Double Peak of Inflation
Last week we asked the question: “Will We See Multiple Waves of Inflation?”
“We have never had inflation running at current levels without experiencing a so-called double top inflation regime. That was the case in 1974-1980 and in 1946-1951. The reason is simple. As soon as disinflationary trends get clearer and clearer, everybody (including politicians) will be screaming at the Fed and the ECB to pivot. Central banks will likely cave in under immense external pressure, no matter what they are saying currently.”
This week we noticed that US real interest rates have been rising since March. Although from a deeply negative level. (Real interest rates are just nominal or the central bank set interest rate less the rate of inflation). US real rates got as low as -7.21% in March but have been on the up since then, however they remain very negative. This long term trends live chart clearly shows this.

Source.
That likely explains the behaviour of precious metals since March too.
Here is the chart of gold in US dollars. Gold has been falling since March, likely because the direction of real interest rates has been up.
The real interest rates chart above also highlights another important occurrence in the 1970’s. See the green box. That shows a second peak in inflation which was higher than the first one. That second peak also saw another peak in nominal interest rates. Along with a second trough in real interest rates.
Or put another way. Inflation peaked in 1975 following which interest rates were cut. Leading to a further spike in inflation and a further increase in interest rates. While real interest rates initially rose but then fell back to a new low in 1980. During this second inflationary peak (and conversely real interest rate trough) is of course when precious metals performed at their best.
So there’s every chance we could see a similar situation play out in this cycle.
Ray Dalio’s Hedge Fund Bridgewater: “Extended period of above-target inflation, and a second round of tightening”
A second peak scenario is exactly what Ray Dalio’s Bridgewater are warning of in their latest update which is worth reading in full. But here is a key section [emphasis added is ours]:
“For the tightening to sustainably reduce inflation will require significant impacts on labor income. Labor income is the sum of two parts, hours worked (dominated by headcount) and wages per hour. The tightening will have to first produce a contraction in the number of people working and raise the unemployment rate by enough and for a long enough period of time to reverse the supply/demand imbalance for labor sufficiently to lower the price of labor, i.e., wages. Only after wage growth slows will inflation stabilize at the levels that central banks want and that the markets are discounting.
Up to this point, the appropriate policy response to the environment has been clear, though it came too late. Strong growth and the emergence of a self-reinforcing, high level of inflation required a tightening. Going forward, the policy choices will be far more challenging when the goals of full employment and stable prices are at odds and the contraction in employment has not been sustained for long enough to bring down wage growth. For most central banks, at that stage there is a tendency to pause and see how things transpire. Such a pause tends to give markets a celebratory reprieve, producing a period of very good asset returns and a pickup in growth, both of which conspire to prevent wages and inflation from settling at the desired level, which necessitates the next round of tightening.
A near-term economic downturn, an extended period of above-target inflation, and a second round of tightening are not discounted in the markets at all. What the markets are now discounting is that the first round of tightening is nearly over, that growth will not slow much and yet inflation will quickly fall to desired levels and that this will allow a cut in interest rates in 2023 and 2024 that restores a normal risk premium in bonds. There is a lot of room for markets to be blindsided by what we see as the normal sequence of events which typically follows the conditions that exist today.”
Source.
The bolded section above is exactly what happened in the 1970’s. As mentioned already this is clearly visible with the two inflation peaks in the real interest rates chart above.
So What About Real Interest Rates in New Zealand?
The above is discussing real rates in the USA. How about here in the land of the long white cloud?
We’ve updated our NZ real interest rates data and then compared this to gold in this week’s feature post. We cover:
- How Do Real Interest Rates Differ From the Overnight Cash Rate (OCR) that the Reserve Bank Fiddles With?
- Why is the “After Inflation” Interest Rate So Important?
- So What is the Real Interest Rate in New Zealand Currently?
- How do you Calculate the Real Interest Rate?
- The Relationship Between Gold and Real Interest Rates
- But What if We Get Higher Inflation and So Interest Rates Start to Rise?
- Where to Next for Real Interest Rates in New Zealand?


Your Questions Wanted
Remember, if you’ve got a specific question, be sure to send it in to be in the running for a 1oz silver coin.
A Solid Argument as to Why Central Banks Won’t Tighten Hard Enough and Long Enough
Last week we also discussed whether the Fed will “Wimp Out” and “Pivot”? That is, will they stop their interest rate increases sooner than they are currently making out they will?
David Stockman uses history to show us how difficult it will be for current central bankers to attempt a “Paul Volker” and crank interest rates higher enough (and for long enough) to tame inflation…
Captain Powell Tries To ‘Communicate’
By David Stockman“…Volcker finally broke the back of cost-push inflation by driving real interest rates to levels that are scarcely imaginable today”.
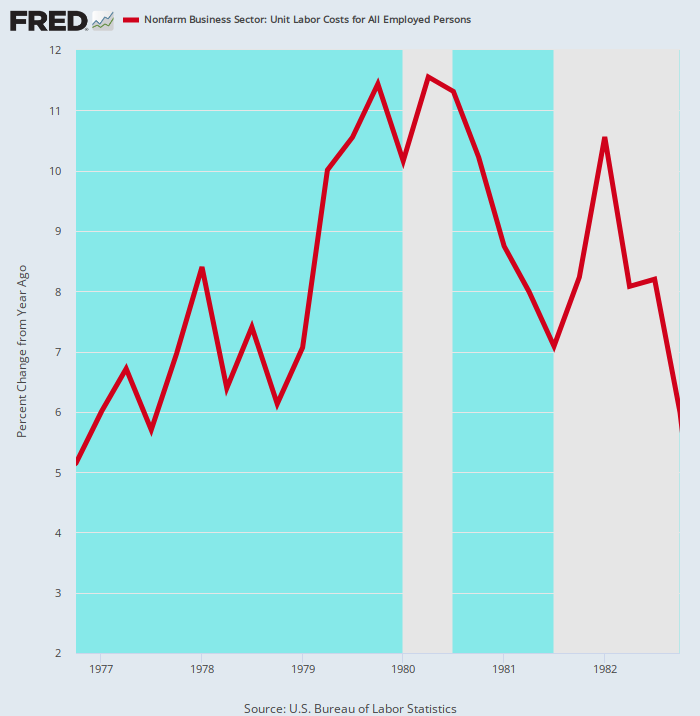
…it was not until early 1983 – after two recessions – that unit labor cost growth returned to its late 1976 level. That is to say, cost push inflation proved to be “sticky” indeed.”
Y/Y Change In Unit Labor Costs, 1976 to 1982
Needless to say, Tall Paul Volcker did not break the back of cost-push inflation by coddling either Wall Street or commodity speculators. To the contrary, he drove real interest rates sky high, and only then did the credit-fueled bubble of the 1970s succumb to financial stringency sufficient to reverse the inflationary momentum.
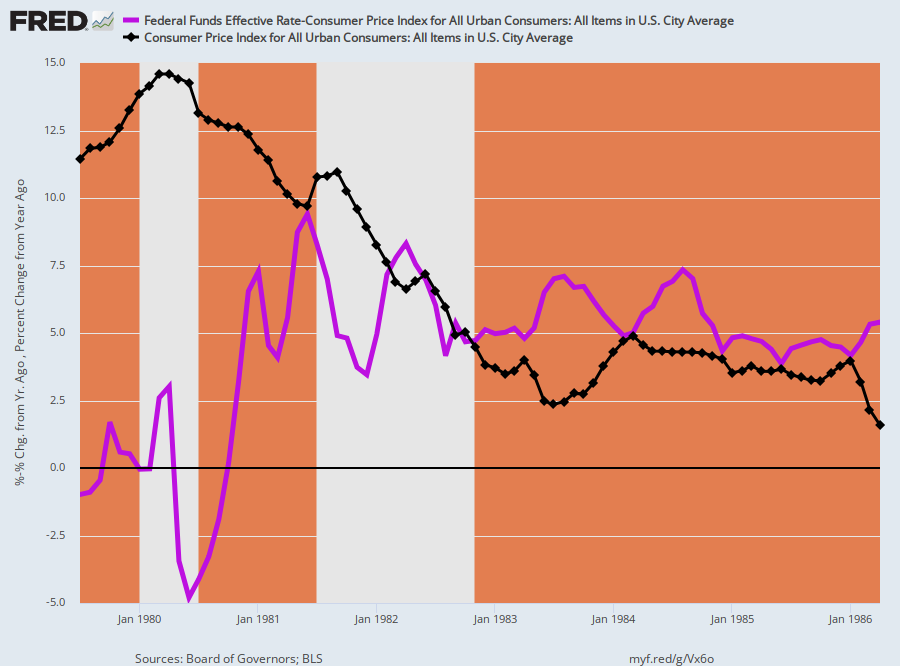
Thus, when Volcker took the helm in August 1979, the inflation-adjusted Fed funds rate (purple line) was slightly negative, while the CPI (black line) was posting at a 11.5% Y/Y rate of increase. So the Volcker Fed kept pushing nominal rates higher – at increments which far outpaced the current Fed increases – until the real rate peaked at 9.4% in June 1981.
In needs be noted, however, that this sustained 23-month long push higher occurred well beyond the time that the CPI peaked at 14.6% Y/Y in March 1980. In fact, when Volcker finally slightly loosened the real rate 15-months later, the Y/Y CPI was already down by 500 basis points to 9.6%.
That is to say, a one-third rollback of the inflationary tide had been deemed insufficient to justify a policy “pivot”, thereby representing a level of monetary discipline that is virtually unthinkable today whether Powell is truly a born-again inflation-fighter or not.
Real Fed Funds Rate Versus Y/Y Change In CPI, 1979 to 1986
This gets us to the $9 trillion question. Does the newly hawkish Jay Powell have even a fraction of the gumption and staying power that Paul Volcker demonstrated 40 years ago?
…..Anyone who presided over the absolute insanity of his first five years in the top chair at the Eccles Building probably cannot be trusted to see it through. After all, when Powell was sworn in as Fed Chairman in January 2018, the Fed’s balance sheet stood at $4.439 trillion, the work of 15 chairmen over 104 years.
When he finally blinked in March 2022 and began to reluctantly raise rates from the zero-bound where they had been hideously impaled, the balance sheet stood at $8.937 trillion.
So the math of it speaks a thousand words. The gain during Powell’s first 50-months was $4.298 trillion, a figure larger than the money-printing total of all of his predecessors combined!”
Source.
Hard to argue with Stockman there. And Ray Dalio has been more right than most in recent years too.
We favour a buy, stack and forget approach. Make sure you have enough gold and silver to cover yourself from these scenarios and then hide it away and forget about it for a few years.
Get in touch if you have any questions about silver or gold:
- Email: [email protected]
- Phone: 0800 888 GOLD ( 0800 888 465 ) (or +64 9 2813898)
- or Shop Online with indicative pricing
— Prepared for the unexpected? —
Never worry about safe drinking water for you or your family again…

The Berkey Gravity Water Filter has been tried and tested in the harshest conditions. Time and again proven to be effective in providing safe drinking water all over the globe.
This filter will provide you and your family with over 22,700 litres of safe drinking water. It’s simple, lightweight, easy to use, and very cost effective.
Shop the Range…
—–
Source link

